MATH302 Week 2 TestScore 20 / 20 - 100 %
- $20.00
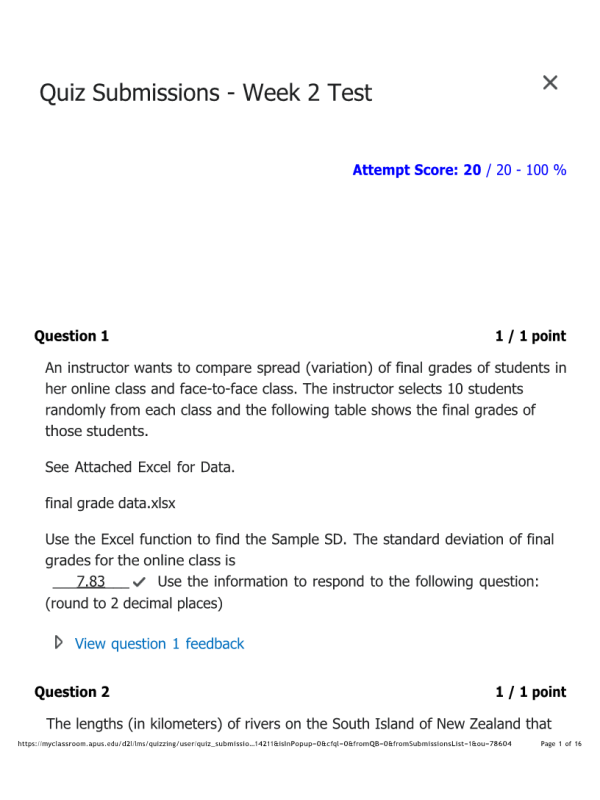
- Question: An instructor wants to compare spread (variation) of final grades of students in her online class and face-to-face class. The instructor selects 10 students randomly from each class and the following table shows the final grades of those students. See Attached Excel for Data.
- Question: The lengths (in kilometers) of rivers on the South Island of New Zealand that flow to the Tasman Sea are listed below. Find the variance. See Attached Excel for Data. Use the Excel function to find the Variance. river length data.xlsx
- Question: A sample of 8 cats found the following weights in kg. What is the variance? See Attached Excel for Data. Use the Excel function to find the Variance. cat weight data.xlsx
- Question: A survey was conducted of 130 purchasers of new BMW 3 series cars, 130 purchasers of new BMW 5 series cars, and 130 purchasers of new BMW 7 series cars. In it, people were asked the age they were when they purchased their car. The following box plots display the results. Which group is most likely to have an outlier?
- Question: Given the following boxplot where m is the median value, what statement could be made about the distribution of the data?
- Question: Given the following boxplot where m is the median value, what statement could be made about the distribution of the data?
- Question: Suppose one hundred eleven people who shopped in a special t-shirt store were asked the number of t-shirts they own costing more than $19 each.
The percentage of all people who own at most three t-shirts costing more than $19 each is approximately:
- Question: A sample of 8 cats found the following weights in kg. What is the mean weight? Do not round your answer. See Attached Excel for the Data.
- Question: The following data show the lengths of boats moored in a marina. The data are ordered from smallest to largest. See Attached Excel for Data.
- Question: The following data show the height (in inches) of a sample of students. See Attached Excel for Data.
- Question: A sample of 8 cats found the following weights in kg. What is the median weight?
- Question: Listed are 29 ages for Academy Award-winning best actors in order from smallest to largest. See Attached Excel for Data.
- Question: Cholesterol levels were collected from patients two days after they had a heart attack (Ryan, Joiner & Ryan, Jr, 1985). Use Excel to find the 25th percentile. Round your answer to one decimal place.
- Question: Cholesterol levels were collected from patients two days after they had a heart attack (Ryan, Joiner & Ryan, Jr, 1985). Use Excel to find the 25th percentile. Round your answer to one decimal place.
- Question: The total frequency of the data whose ogive is shown below is approximately
- Question: The following data represents the percent change in tuition levels at public, four-year colleges (inflation adjusted) from 2008 to 2013 (Weissmann, 2013). Below is the frequency distribution and ogive. Based on the information, how many colleges were sampled?
- A survey by the Pew Research Center, conducted in 16 countries among 20,132 respondents from April 4 to May 29, 2016, before the United Kingdom's so-called Brexit referendum to exit the EU. The following is a time series graph for the proportion of survey respondents by country that responded that the current economic situation is their country was good. Which country had the most favorable outlook of their country's economic situation in 2010?
- Question: The following scatterplot shows the hours studied for an exam and the grade for a sample of students. What is the relationship between the variables displayed in the scatterplot?
- Question: An instructor had the following grades recorded for an exam. What is the value of the missing leaf?
- Question: The following data show the height (in inches) of sample of students. 67 70 71 61 71 67 69 68 66 65 67 67 64 71 69 67 67 64 62 69 Create a stem leaf plot for these data and then select all of the correct statements about these data based on your plot.
