MATH302 Week 6 Test
- $20.00
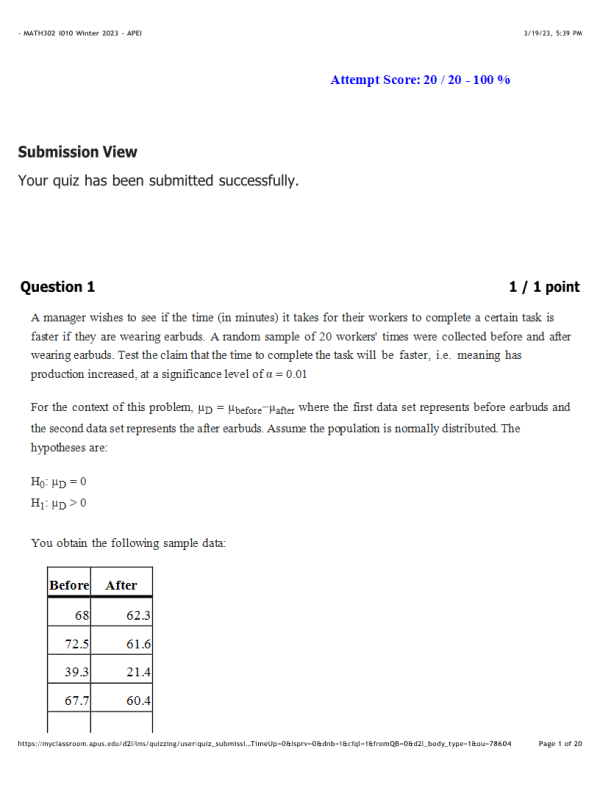
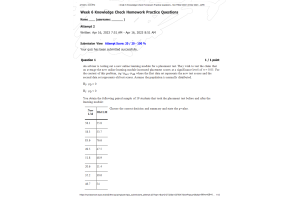
- Question: A manager wishes to see if the time (in minutes) it takes for their workers to complete a certain task is faster if they are wearing earbuds. A random sample of 20 workers' times were collected before and after wearing earbuds. Test the claim that the time to complete the task will be faster, i.e. meaning has production increased, at a significance level of α = 0.01 For the context of this problem, µD = µbefore−µafter where the first data set represents before earbuds and the second data set represents the after earbuds. Assume the population is normally distributed. The hypotheses are:
- Question: A manager wants to see if it is worth going back for an MBA degree. They randomly sample 18 managers' salaries before and after undertaking a MBA degree and record their salaries in thousands of dollars. Assume Salaries are normally distributed. Test the claim that the MBA degree, on average, increases a manager's salary. Use a 10% level of significance.
- Question: A high school is running a campaign against the over-use of technology in teens. The committee running the campaign decides to look at the difference in social media usage between teens and adults. They take a random sample of 200 teens in their city (Group 1) and find that 85% of them use social media, and then take another random sample of 180 adults in their city (Group 2) and find that 55% of them use social media. Find a 90% confidence interval for the difference in proportions.
- Question: The makers of a smartphone have received complaints that the face recognition tool often doesn't work, or takes multiple attempts to finally unlock the phone. They've upgraded to a new version and are claiming the tool has improved. To test the claim, a critic takes a random sample of 80 users of the new version (Group 1) and 75 users of the old version (Group 2). He finds that the face recognition tool works on the first try 70% of the time in the new version and 56% of the time in the old version. Can it be concluded that the new version is performing better?
- Question: Two competing toothpaste brands both claim to produce the best toothpaste for whitening. A dentist randomly samples 48 patients that use Brand A (Group 1) and finds 30 of them are satisfied with the whitening results of the toothpaste. She then randomly samples 45 patients that use Brand B (Group 2) and finds 33 of them are satisfied with the whitening results of the toothpaste. Construct a 99% confidence interval for the difference in proportions and use it to decide if there is a significant difference in the satisfaction level of patients.
- Question: Results from previous studies showed 79% of all high school seniors from a certain city plan to attend college after graduation. A random sample of 200 high school seniors from this city reveals that 162 plan to attend college. Does this indicate that the percentage has increased from that of previous studies?
- Question: A null hypothesis can only be rejected at the 5% significance level if and only if:
- Question: If a teacher is trying to prove that a new method of teaching economics is more effective than a traditional one, he/she will conduct a:
- Question: The hypothesis that an analyst is trying to prove is called the:
- Question: Smaller p-values indicate more evidence in support of the:
- Question: A new over-the-counter medicine to treat a sore throat is to be tested for effectiveness. The makers of the medicine take two random samples of 25 individuals showing symptoms of a sore throat. Group 1 receives the new medicine and Group 2 receives a placebo. After a few days on the medicine, each group is interviewed and asked how they would rate their comfort level 1-10 (1 being the most uncomfortable and 10 being no discomfort at all). The results are below. Find the 95% confidence interval in the difference of the mean comfort level. Is there sufficient evidence to conclude that the new medicine is effective?
- Question: You are testing the claim that the mean GPA of night students is less than the mean GPA of day students. You sample 30 night students and 30 day students. Test the claim using a 10% level of significance. Assume the population standard deviations are unequal.
- Question: A new over-the-counter medicine to treat a sore throat is to be tested for effectiveness. The makers of the medicine take two random samples of 25 individuals showing symptoms of a sore throat. Group 1 receives the new medicine and Group 2 receives a placebo. After a few days on the medicine, each group is interviewed and asked how they would rate their comfort level 1-10 (1 being the most uncomfortable and 10 being no discomfort at all). The results are below. Find the 90% confidence interval in the difference of the mean comfort level. Is there sufficient evidence to conclude that the new medicine is effective?
- Question: A physical therapist believes that at 30 years old adults begin to decline in flexibility and agility. To test this, he randomly samples 25 of his patients who are less than 30 years old and 27 of his patients are 30 or older and measures each patient's flexibility in the Sit-and-Reach test. Assume the populations are normally distributed. The results are below.
- Question: Which of the following is a requirement that must be true in order to run a t-test over a z-test?
- Question: In a survey of 1000 high school students in Oregon, the average SAT score for 500 students who chose to go out of state for college (Group 1) was 1225 and the average SAT score for 500 students who chose to stay in state for college (Group 2) was 1130. The population standard deviation for students who choose to go out of state is 95 and the population standard deviation for students who choose to stay in state is 103. Find a 95% confidence interval and decide if the SAT scores between the two groups is significantly different. Confidence Interval (round to 4 decimal places):
- Question: In a survey of 100 U.S. residents with a high school diploma as their highest educational degree (Group 1) had an average yearly income was $35,621. Another 120 U.S. residents with a GED (Group 2) had an average yearly income of $34,498. The population standard deviation for both populations is known to be $4,150. At a 0.01 level of significance, can it be concluded that U.S. residents with a high school diploma make significantly more than those with a GED? Make sure you put the 0 in front of the decimal.
- Question: A 2011 survey, by the Bureau of Labor Statistics, reported that 91% of Americans have paid leave. In January 2012, a random survey of 1000 workers showed that 89% had paid leave. The resulting p-value is .0271; thus, the null hypothesis is rejected. It is concluded that there has been a decrease in the proportion of people, who have paid leave from 2011 to January 2012. What type of error is possible in this situation?
- Question: The plant-breeding department at a major university developed a new hybrid boysenberry plant called Stumptown Berry. Based on research data, the claim is made that from the time shoots are planted 90 days on average are required to obtain the first berry. A corporation that is interested in marketing the product, tests 60 shoots by planting them and recording the number of days before each plant produces its first berry. The sample mean is 92.3 days. The corporation will not market the product if the mean number of days is more than the 90 days claimed.
- Question: The workweek for adults in the US that work full time is normally distributed with a mean of 47 hours. A newly hired engineer at a start-up company believes that employees at start-up companies work more on average then working adults in the US. She asks 15 engineering friends at start-ups for the lengths in hours of their workweek. Their responses are shown in the table below. Test the claim using a 1% level of significance.
