MATH302 Week 7 Test
- $20.00
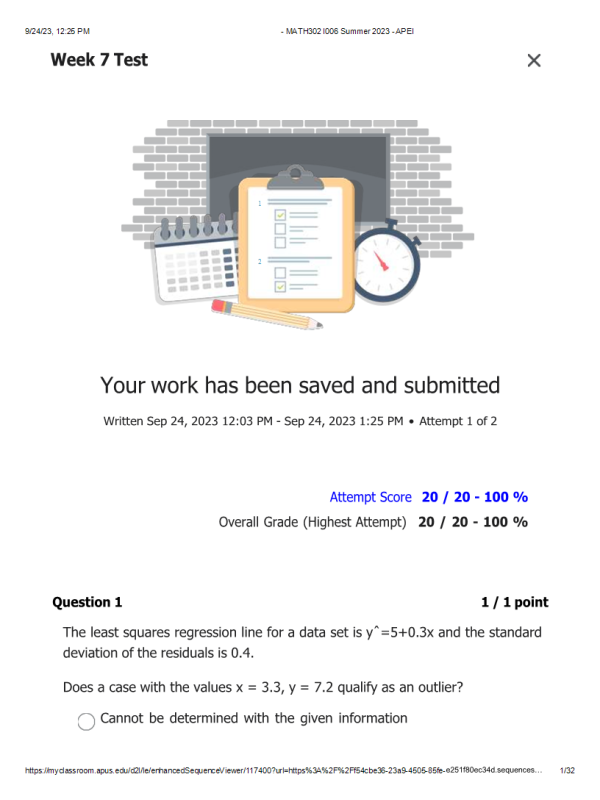
- Question: The least squares regression line for a data set is yˆ=5+0.3x and the standard deviation of the residuals is 0.4. Does a case with the values x = 3.3, y = 7.2 qualify as an outlier?
- Question: The least squares regression line for a data set is yˆ=5+0.3x and the standard deviation of the residuals is 0.52. Does a case with the values x = -1.59, y = 5.78 qualify as an outlier?
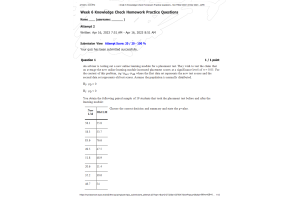
- Question: The following data represent the weight of a child riding a bike and the rolling distance achieved after going down a hill without pedaling. Can it be concluded at a 0.05 level of significance that there is a linear correlation between the two variables?
- Question: The marketing manager of a large supermarket chain would like to use shelf space to predict the sales of pet food. For a random sample of 15 similar stores, she gathered the following information regarding the shelf space, in feet, devoted to pet food and the weekly sales in hundreds of dollars. .
- Question: The following data represent the weight of a child riding a bike and the rolling distance achieved after going down a hill without pedaling.
- Question: Which of the following describes how the scatter plot appears? Select all that apply.
- Question: Data for a sample of 30 apartments in a particular neighborhood are provided in the worksheet. You want to see if there is a direct relationship between Size of the Apartment and Rent. Base on your results, If the Size of your Apartment increased by 1 Sq. Ft., on average, the Rent would increase by approximately how much?
- Question: A company want to find out if there is a linear relationship between indirect labor expense (ILE), in dollars, and direct labor hours (DLH). Data for direct labor hours and indirect labor expense for 25 months are given. Approximately what percentage of the variation in indirect labor expenses is explained by the regression model you derived?
- The city of Oakdale wishes to see if there is a linear relationship between the temperature and the amount of electricity used (in kilowatts). Using the estimated regression equation found by using Temperature as the predictor variable, find a point estimate Kilowatt usage when the Temperature is 90 degrees outside?
- Question: Data for a sample of 30 apartments in a particular neighborhood are provided in the worksheet. You want to see if there is a direct relationship between Size of the Apartment and Rent. Approximately what percentage of the variation in Rent is explained by the regression model you derived?
- Question: The city of Oakdale wishes to see if there is a linear relationship between the temperature and the amount of electricity used (in kilowatts). Approximately what percentage of the variation in Kilowatts is accounted for by Temperature in this model?
- Question: Bone mineral density and cola consumption has been recorded for a sample of patients. Let x represent the number of colas consumed per week and y the bone mineral density in grams per cubic centimeter. Assume the data is normally distributed. Calculate the correlation coefficient using technology (you can copy and paste the data into Excel).
- Question: A teacher believes that the third homework assignment is a key predictor in how well students will do on the midterm. Let x represent the third homework score and y the midterm exam score. A random sample of last terms students were selected and their grades are shown below. Assume scores are normally distributed.
- Question: A teacher believes that the third homework assignment is a key predictor in how well students will do on the midterm. Let x represent the third homework score and y the midterm exam score. A random sample of last terms students were selected and their grades are shown below. Assume scores are normally distributed.
- Question: A teacher believes that the third homework assignment is a key predictor in how well students will do on the midterm. Let x represent the third homework score and y the midterm exam score. A random sample of last terms students were selected and their grades are shown below. Assume scores are normally distributed.
- Question: Bone mineral density and cola consumption has been recorded for a sample of patients. Let x represent the number of colas consumed per week and y the bone mineral density in grams per cubic centimeter. Assume the data is normally distributed.
- Question: You move out into the country and you notice every Spring there are more and more Deer Fawns that appear. You decide to try and predict how many Fawns there will be for the up coming Spring. You collect data to, to help estimate Fawn Count for the upcoming Spring season. You collect data on over the past 10 years.
- Question: You decided to join a fantasy Baseball league and you think the best way to pick your players is to look at their Batting Averages. You want to use data from the previous season to help predict Batting Averages to know which players to pick for the upcoming season. You want to use Runs Score, Doubles, Triples, Home Runs and Strike Outs to determine if there is a significant linear relationship for Batting Averages. You collect data to, to help estimate Batting Average, to see which players you should choose. You collect data on 45 players to help make your decision.
- Question: With Obesity on the rise, a Doctor wants to see if there is a linear relationship between the Age and Weight and estimating a person's Systolic Blood Pressure. Using the Estimated Regression equation, Estimate Systolic BP when some if 39 years old and they weigh 143 pound.
- Question: You are thinking about opening up a Starbucks in your area but what to know if it is a good investment. How much money do Starbucks actually make in a year? You collect data to, to help estimate Annual Net Sales, in thousands, of dollars to know how much money you will be making. You collect data on 27 stores to help make your decision.
