MATH302 Week 8 Test
- $20.00
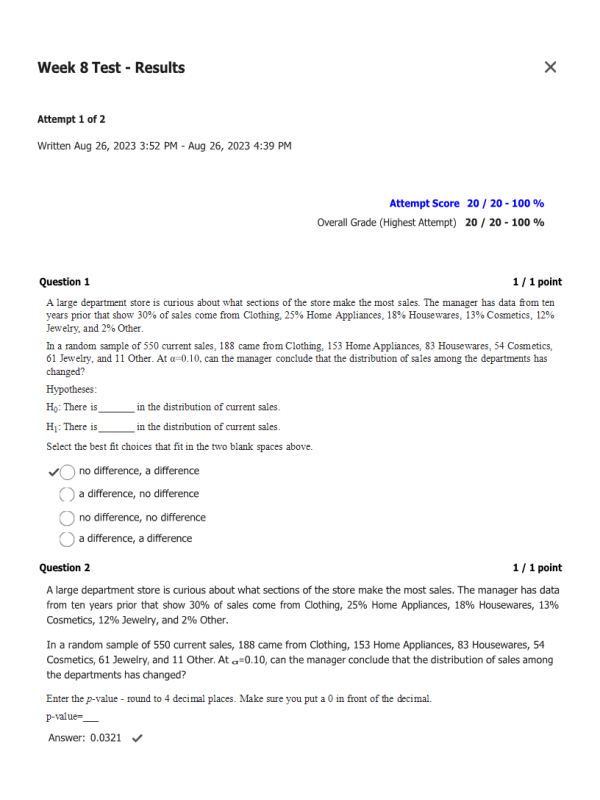
- Question: A large department store is curious about what sections of the store make the most sales. The manager has data from ten years prior that show 30% of sales come from Clothing, 25% Home Appliances, 18% Housewares, 13% Cosmetics, 12% Jewelry, and 2% Other. In a random sample of 550 current sales, 188 came from Clothing, 153 Home Appliances, 83 Housewares, 54 Cosmetics, 61 Jewelry, and 11 Other. At α=0.10, can the manager conclude that the distribution of sales among the departments has changed?
- Question: A A large department store is curious about what sections of the store make the most sales. The manager has data from ten years prior that show 30% of sales come from Clothing, 25% Home Appliances, 18% Housewares, 13% Cosmetics, 12% Jewelry, and 2% Other. In a random sample of 550 current sales, 188 came from Clothing, 153 Home Appliances, 83 Housewares, 54 Cosmetics, 61 Jewelry, and 11 Other. At α=0.10, can the manager conclude that the distribution of sales among the departments has changed?
- Question: A An urban economist is curious if the distribution in where Oregon residents live is different today than it was in 1990. She observes that today there are approximately 3,109 thousand residents in NW Oregon, 902 thousand residents in SW Oregon, 244 thousand in Central Oregon, and 102 thousand in Eastern Oregon. She knows that in 1990 the breakdown was as follows: 72.7% NW Oregon, 20.7% SW Oregon, 4.8% Central Oregon, and 2.8% Eastern Oregon. Can she conclude that the distribution in residence is different today at a 0.05 level of significance?
- Question: A A college prep school advertises that their students are more prepared to succeed in college than other schools. To verify this, they categorize GPA's into 4 groups and look up the proportion of students at a state college in each category. They find that 7% have a 0-0.99, 21% have a 1-1.99, 37% have a 2-2.99, and 35% have a 3-4.00 in GPA. They then take a random sample of 200 of their graduates at the state college and find that 19 has a 0-0.99, 28 have a 1-1.99, 82 have a 2-2.99, and 71 have a 3-4.00. Can they conclude that the grades of their graduates are distributed differently than the general population at the school? Test at the 0.05 level of significance.
- Question: A A company manager believes that a person's ability to be a leader is directly correlated to their zodiac sign. He never selects someone to chair a committee without first evaluating their zodiac sign. An irate employee sets out to prove her manager wrong. She claims that if zodiac sign truly makes a difference in leadership, then a random sample of 210 CEO's in our country would reveal a difference in zodiac sign distribution. She finds the following zodiac signs for her random sample of 210 CEO's: Can she conclude that zodiac sign makes a difference in whether or not a person makes a good leader?
- Question: A A company that develops over-the-counter medicines is working on a new product that is meant to shorten the length of sore throats. To test their product for effectiveness, they take a random sample of 110 people and record how long it took for their symptoms to completely disappear. The results are in the table below. The company knows that on average (without medication) it takes a sore throat 6 days or less to heal 42% of the time, 7-9 days 31% of the time, 10-12 days 16% of the time, and 13 days or more 11% of the time. Can it be concluded at the 0.01 level of significance that the patients who took the medicine healed at a different rate than these percentages?
- Question: A color code personality test categorizes people into four colors – Red (Power), Blue (Intimacy), Green (Peace), and Yellow (Fun). In general, 25% of people are Red, 35% Blue, 20% Green, and 20% Yellow. An art class of 45 students is tested at a university and 7 are found to be Red, 18 Blue, 9 Green, and 11 Yellow. Can it be concluded that personality type has an impact on students' areas of interest and talents, such as artistic students? Test at a 0.05 level of significance. Enter the observed and expected counts for each category in the table below. Do Not Round.
- Question: A The permanent residence of adults aged 18-25 in the U.S. was examined in a survey from the year 2000. The survey revealed that 27% of these adults lived alone, 32% lived with a roommate(s), and 41% lived with their parents/guardians. In 2008, during an economic recession in the country, another such survey of 1600 people revealed that 398 lived alone, 488 lived with a roommate(s), and 714 lived with their parents. Is there a significant difference in where young adults lived in 2000 versus 2008? Test with a Goodness of Fit test at α=0.05. Enter the observed and expected counts for each category in the table below. Round to whole numbers.
- Question: A The data presented in the table below resulted from an experiment in which seeds of 4 different types were planted and the number of seeds that germinated within 4 weeks after planting was recorded for each seed type. At the .05 level of significance, is the proportion of seeds that germinate dependent on the seed type?
- Question: A The data presented in the table below resulted from an experiment in which seeds of 4 different types were planted and the number of seeds that germinated within 4 weeks after planting was recorded for each seed type. At the .05 level of significance, is the proportion of seeds that germinate dependent on the seed type? What is the Expected Count for Seed Type = 1 and a Failed to Germinated Seed?
- Question: A The data presented in the table below resulted from an experiment in which seeds of 4 different types were planted and the number of seeds that germinated within 4 weeks after planting was recorded for each seed type. At the .05 level of significance, is the proportion of seeds that germinate dependent on the seed type?
- Question: A A high school runs a survey asking students if they participate in sports. The results are found below. Run an independence test for the data at α=0.01.
- Question: A A local gym is looking in to purchasing more exercise equipment and runs a survey to find out the preference in exercise equipment amongst their members. They categorize the members based on how frequently they use the gym each month – the results are below. Run an independence test at the 0.01 level of significance.
- Question: A A local gym is looking in to purchasing more exercise equipment and runs a survey to find out the preference in exercise equipment amongst their members. They categorize the members based on how frequently they use the gym each month – the results are below. Run an independence test at the 0.01 level of significance. Can it be concluded that preference in exercise equipment is dependent on gym usage?
- Question: A An electronics store has 4 branches in a large city. They are curious if sales in any particular department are different depending on location. They take a random sample of 4 purchases throughout the 4 branches – the results are recorded below. Run an independence test for the data below at the 0.05 level of significance.
- Question: A The following sample was collected during registration at a large middle school. At the 0.05 level of significance, can it be concluded that level of math is dependent on grade level?
- Question: A You are conducting a study of three types of feed supplements for cattle to test their effectiveness in producing weight gain among calves whose feed includes one of the supplements. You have four groups of 30 calves (one is a control group receiving the usual feed, but no supplement). You will conduct a one-way ANOVA after one year to see if there are difference in the mean weight for the four groups.
- Question: A The following data represent weights (pounds) of a random sample of professional football players on the following teams.
- The following data represent weights (pounds) of a random sample of professional football players on the following teams.
- The following data represent weights (pounds) of a random sample of professional football players on the following teams.
